Beyond the Ban: An Overview of California School Suspension Data
Introduction
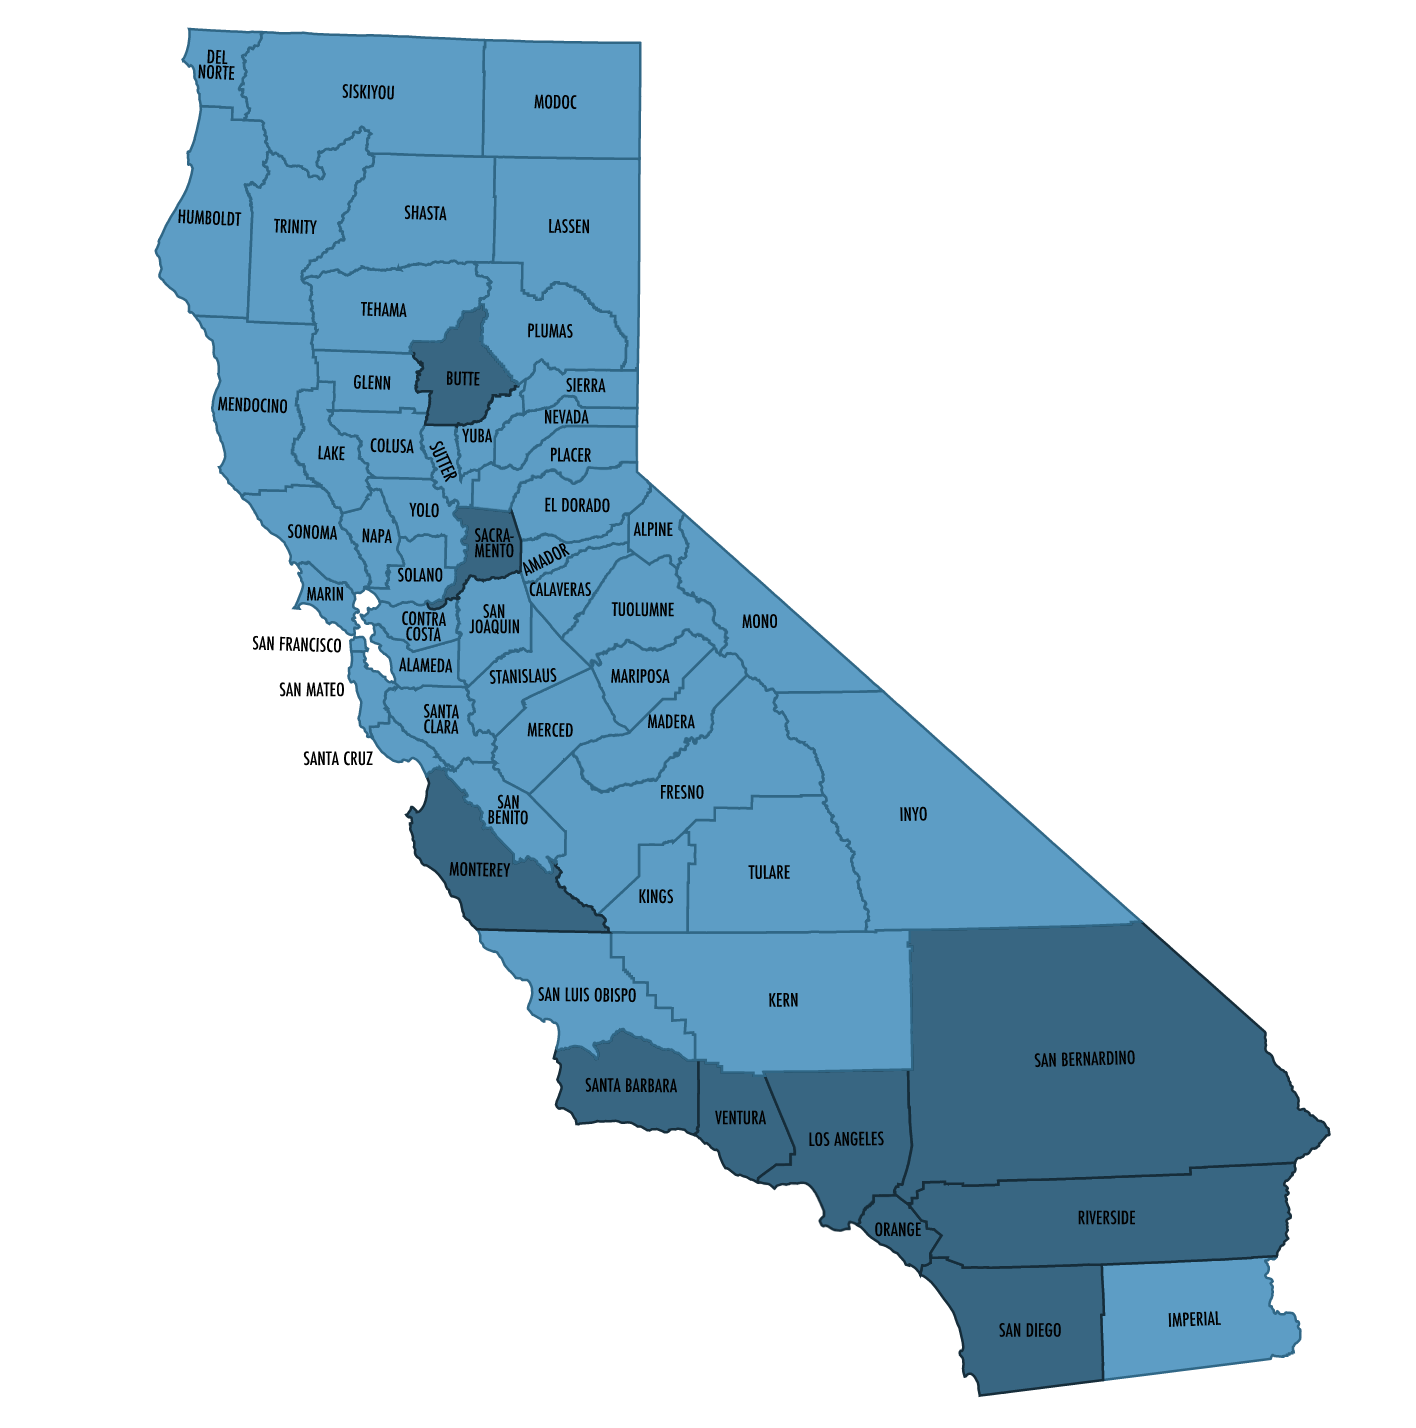
This brief analyzes statewide suspension data from 2017–18 through 2023–24 to better understand patterns and how recent legislation and practices can shape outcomes.
Racial disparities in suspension rates have remained mostly unchanged, even after recent legislation banning willful defiance suspensions like California’s recent ban on suspensions for willful defiance through AB 420, SB 419, and SB 274. The data reveals system-wide inequities, most notably impacting Black/African American and American Indian/Alaska Native students, who are being suspended at nearly triple (Black/African American) and quadruple (American Indian/Alaska Native) the rate of the statewide average.
A small group of schools account for almost half of all elementary suspensions statewide:
49%
of suspensions happened in 328 elementary schools
(out of 3,276 total in California)
Middle and high school data show similar trends, with 10% of middle schools accounting for 35% of all suspensions and 10% of high schools accounting for 40% of all suspensions. This suggests that while all schools might contribute to statewide suspension rates, some might be over-reliant on exclusionary student discipline practices.
Our analysis points to the need for restorative, equity-driven approaches that strengthen relationships and reduce and repair harm.
Key Findings
Student Suspension Data Reveal System-Wide Inequities
Black/African American and American Indian/Alaska Native students are overrepresented with statewide suspension rates of 12.8% (Black/African American) and 16.1% (American Indian/Alaska Native) during the 2023-24 school year. These rates are nearly triple and quadruple the rate of 4.3% of all California students combined. Data across the six years mostly demonstrates slight shifts but no real narrowing of racial disparity gaps, despite a dramatic decrease at the start of the COVID-19 pandemic.
Disparities Persist Despite Overall School Population Demographics
Regardless of the demographic makeup of a school, Black/African American and American Indian/Alaska Native students are among those with the highest rates of suspension (as demonstrated in tables below). Further analysis reveals suspension rates for all groups were mostly higher in schools with predominantly Black student populations (compared to schools with a smaller proportion of Black students). Conversely, suspension rates for almost all groups were lower in schools with predominantly white student populations, but still disproportionately higher particularly for Black students in those schools.
Unequal Burden: Concentration of Suspensions Suggests School Climate Concerns
Suspensions remain highly concentrated within a smaller share of traditional schools. Across 2017-18 and 2023-24, a significant portion of overall suspensions came from just a few schools. During the 2023-24 school year specifically, the schools with the highest rates of suspension (top 10%) account for a significant portion of suspensions across all elementary, middle, and high schools. For example, 49% of suspensions happened in just 328 elementary schools (out of 3,276 across the state). This suggests that while all schools might contribute to statewide suspension rates, some might have an over-reliance on exclusionary student discipline practices.
Recommendations
Committing to Data-Driven Decision-Making
- Regular analysis of discipline data & patterns
- Tracking proactive metrics (eg, sense of belonging)
- Ongoing cycle of inquiry & continuous improvement
Leading a Culture of Empathy and Support
- Broad implementation of restorative practices
- Social-emotional learning integration
- Cultural responsiveness training
- Model mindset shift from the top
Integrating Family and Community Engagement
- Family engagement initiatives
- Community resource partnerships
- Build in family and community voices